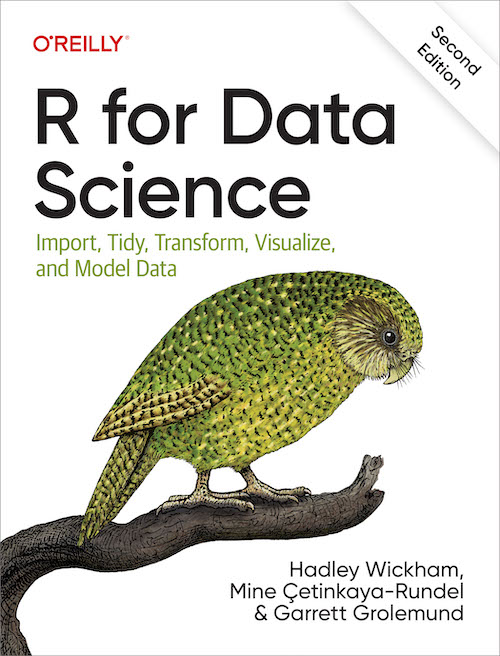
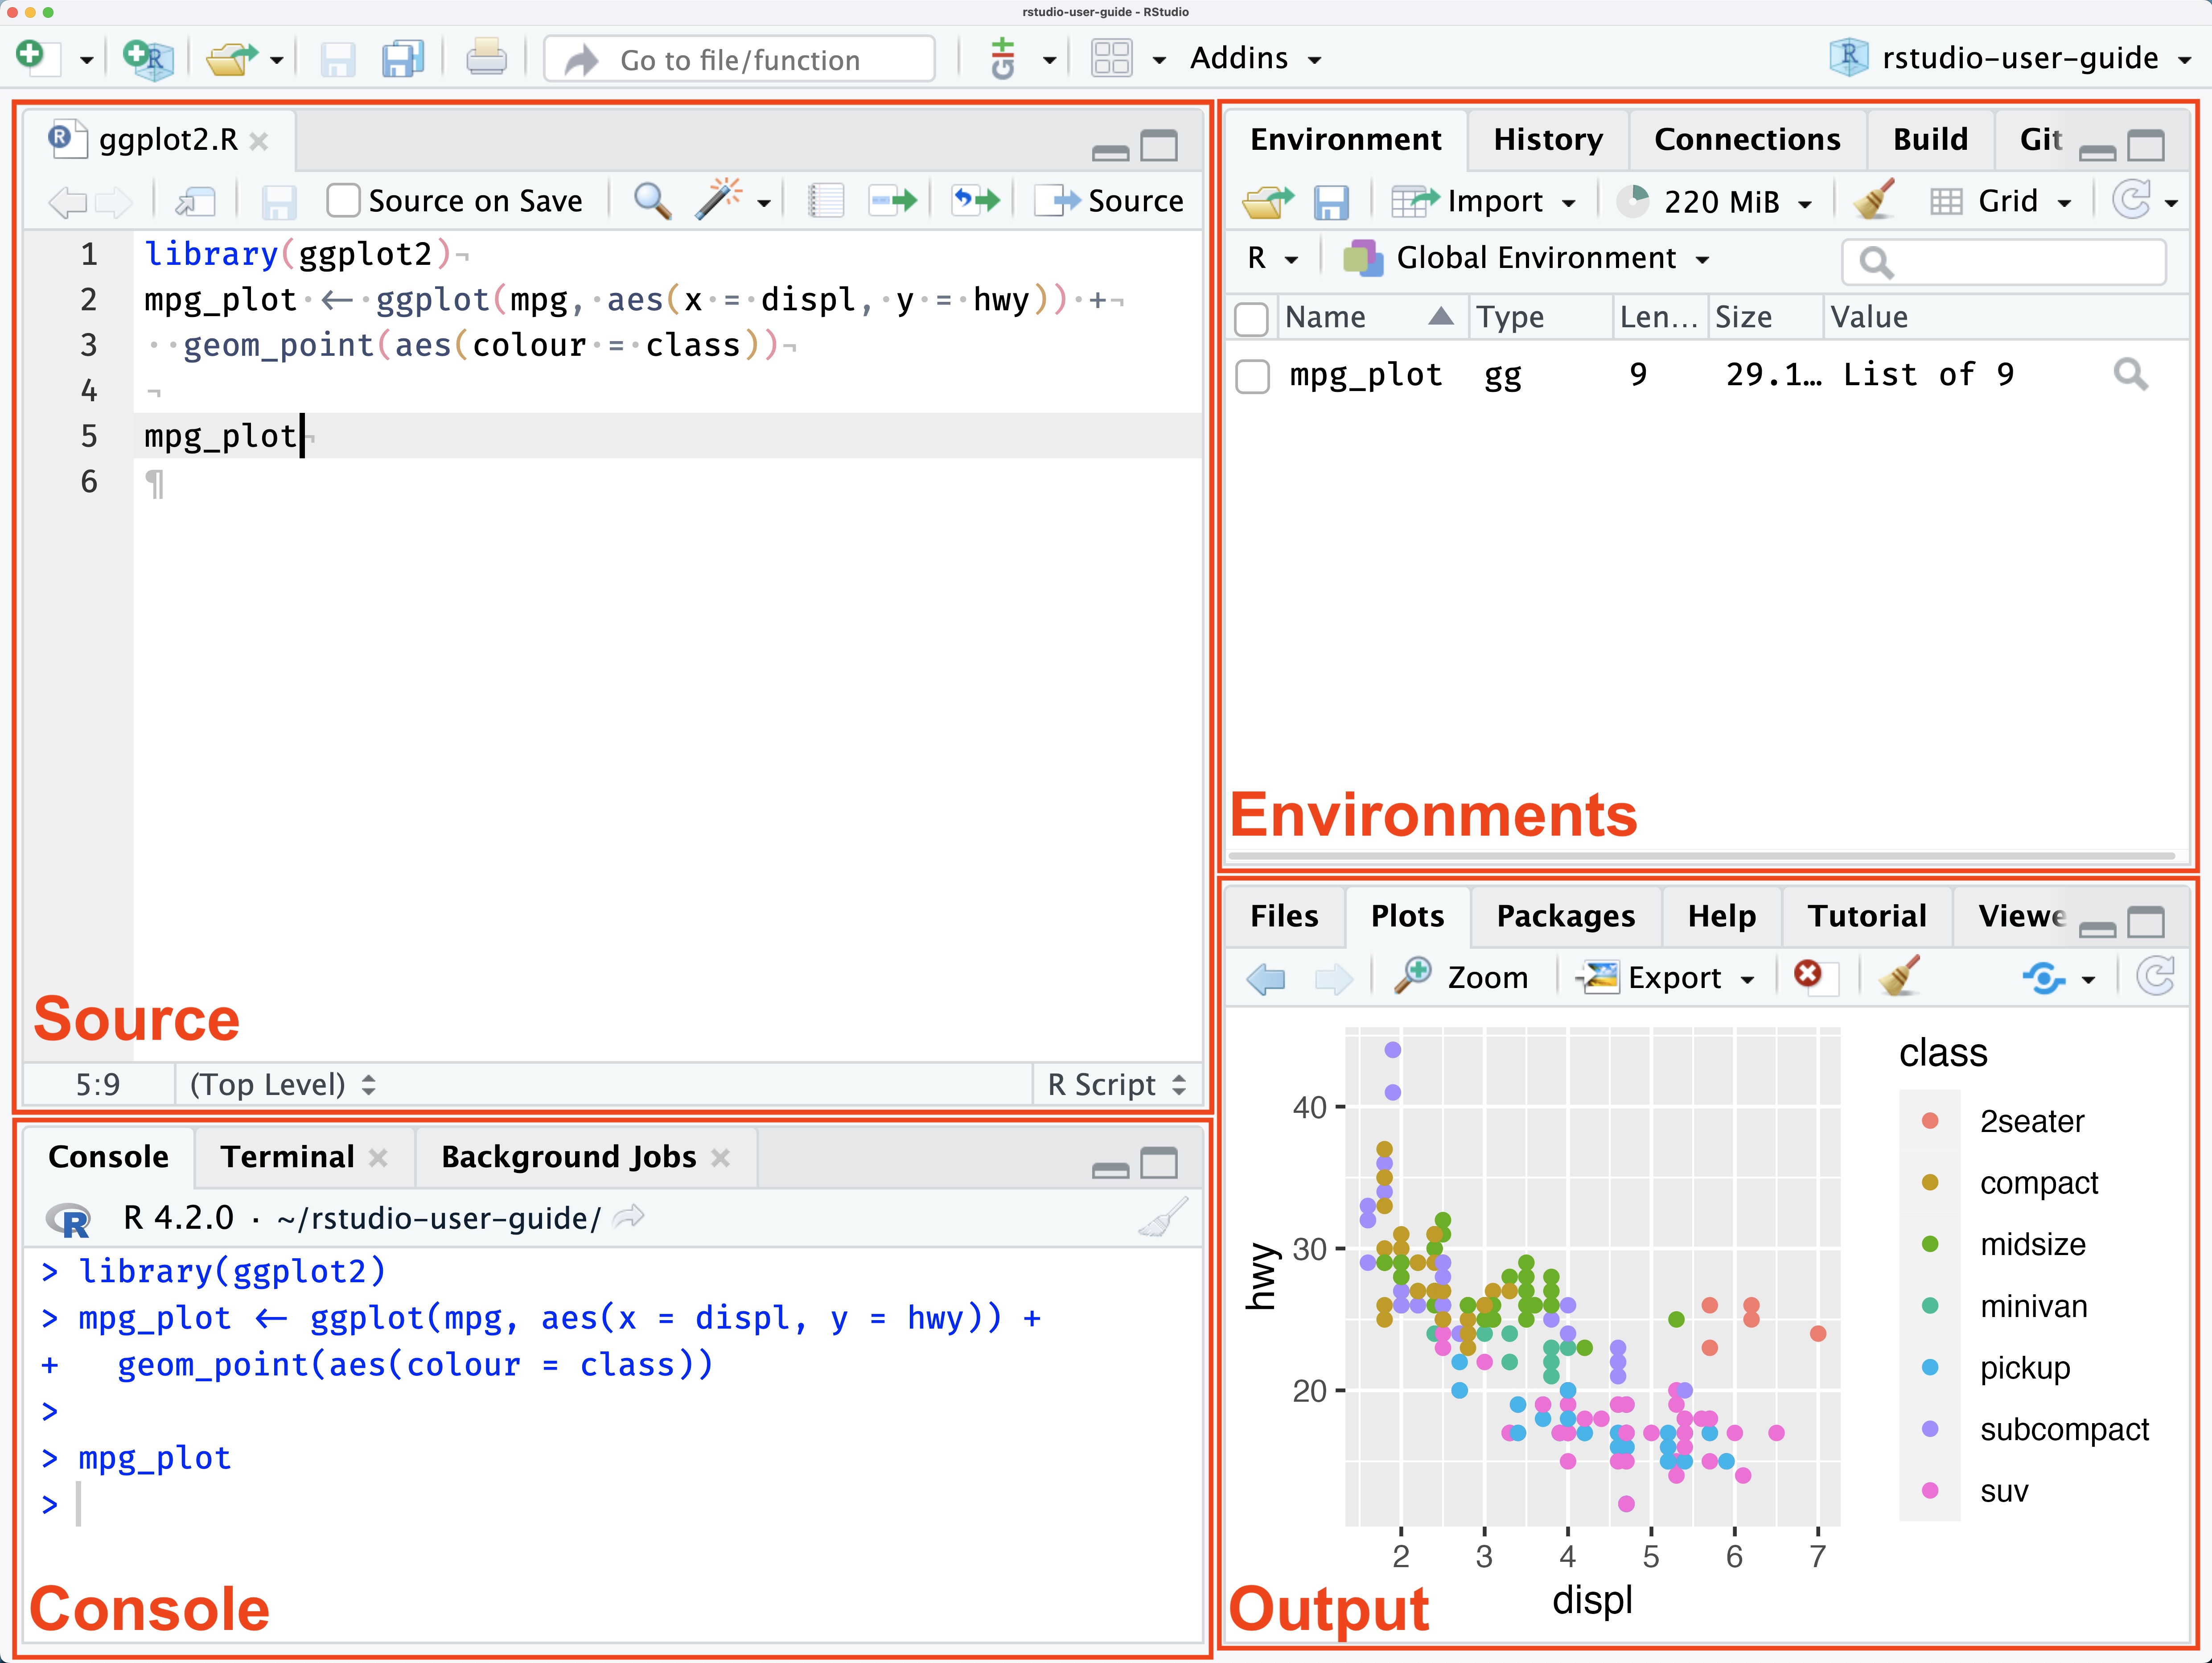
class: center, middle, inverse, title-slide # R for Data Science ## With Sports Applications ### Rafael La Buonora ### 2023-09-20 --- ## Course Philosophy - Hands on - Strong Fundamentals: run before you fly - Relevance to your job --- .pull-left[  ] .pull-right[ - Leading introductory textbook by Hadley Wickham and coauthors. - [Available online for free](https://r4ds.hadley.nz/) - Examples from books and blogs. ] --- ## Data Scientists task .center[ ] --- ## Data Import - Excel, text files. - Databases - Internet: APIS, data scraping - Devices (GPS, Imaging, etc.) --- ## Data Wrangling > 80% of data analysis is spent on the process of cleaning and preparing the data (Dasu and Johnson 2003) --- ## Modeling - Stats stuff --- ## Visualize - Exploratory, interactive visualization. --- ## Communicate - Communicating your findings effectively to stakeholders is crucial for success of data science. - R supports multiple ways of presenting your results: blogs, written documents, data visualization and interactive applications. --- ## Documents [Informe URSEC](https://www.gub.uy/unidad-reguladora-servicios-comunicaciones/datos-y-estadisticas/estadisticas/informes-mercado-del-sector-telecomunicaciones) --- ## Slide Decks - This one! --- ## Blogs - http://sportstatisticsrsweet.rbind.io/ - https://www.mitchhenderson.org/ --- background-image: url(./imgs/legs.png) background-size: 65% 65% ## Visualization (1) .footnote[From [sportstatisticsrsweet.rbind.io]()] --- background-image: url(./imgs/left_vs_right.png) background-size: 65% 65% ## Visualization (2) .footnote[[Mitch Henderson](https://www.mitchhenderson.org/)] --- background-image: url(./imgs/heat_map.png) background-position: right background-size: contain ## Visualization (3) .foonote[Basketball Data Science: With Applications in R] --- ## Themes - [Use theming to adhere to styleguides] (https://bbc.github.io/rcookbook/) --- ## Interactive applications https://shiny-eio.upc.edu/pubs/sport-R-packages/ --- ## Open Source, reproducibility, et all - R's strength is its community - Workshops, blogs, Journals, etc. --- class: inverse center middle # Getting started --- ## R & RStudio .pull-left[  ] .pull-right[ - RStudio is a __computing environment__ - R is a __programming language__ ] --- ## RStudio .pull-left[  ] .pull-right[ - You do not use a lot of the windows. - You need to use well the ones you use. ] --- ## RStudio (2) - Working Directory - `getwd()`, `setwd()`, `list.files()`. - `install.packages()` - Sourcing scripts `.R` - Opening data files `(.rds)` --- ## R - Functions and objects - Variables and assignment - Side effects --- ## Objects ```r x <- c(1, 2, 3) ``` --- ## Objects (2) The Data Frame .pull-left[ - Similar to an Excel spreadsheet (?) - It has rows and columns - Each row is an observation - Each column is a feature of the data ] .pull-right[ ```r mtcars ``` ``` ## mpg cyl disp hp drat wt qsec vs am gear carb ## Mazda RX4 21.0 6 160.0 110 3.90 2.620 16.46 0 1 4 4 ## Mazda RX4 Wag 21.0 6 160.0 110 3.90 2.875 17.02 0 1 4 4 ## Datsun 710 22.8 4 108.0 93 3.85 2.320 18.61 1 1 4 1 ## Hornet 4 Drive 21.4 6 258.0 110 3.08 3.215 19.44 1 0 3 1 ## Hornet Sportabout 18.7 8 360.0 175 3.15 3.440 17.02 0 0 3 2 ## Valiant 18.1 6 225.0 105 2.76 3.460 20.22 1 0 3 1 ## Duster 360 14.3 8 360.0 245 3.21 3.570 15.84 0 0 3 4 ## Merc 240D 24.4 4 146.7 62 3.69 3.190 20.00 1 0 4 2 ## Merc 230 22.8 4 140.8 95 3.92 3.150 22.90 1 0 4 2 ## Merc 280 19.2 6 167.6 123 3.92 3.440 18.30 1 0 4 4 ## Merc 280C 17.8 6 167.6 123 3.92 3.440 18.90 1 0 4 4 ## Merc 450SE 16.4 8 275.8 180 3.07 4.070 17.40 0 0 3 3 ## Merc 450SL 17.3 8 275.8 180 3.07 3.730 17.60 0 0 3 3 ## Merc 450SLC 15.2 8 275.8 180 3.07 3.780 18.00 0 0 3 3 ## Cadillac Fleetwood 10.4 8 472.0 205 2.93 5.250 17.98 0 0 3 4 ## Lincoln Continental 10.4 8 460.0 215 3.00 5.424 17.82 0 0 3 4 ## Chrysler Imperial 14.7 8 440.0 230 3.23 5.345 17.42 0 0 3 4 ## Fiat 128 32.4 4 78.7 66 4.08 2.200 19.47 1 1 4 1 ## Honda Civic 30.4 4 75.7 52 4.93 1.615 18.52 1 1 4 2 ## Toyota Corolla 33.9 4 71.1 65 4.22 1.835 19.90 1 1 4 1 ## Toyota Corona 21.5 4 120.1 97 3.70 2.465 20.01 1 0 3 1 ## Dodge Challenger 15.5 8 318.0 150 2.76 3.520 16.87 0 0 3 2 ## AMC Javelin 15.2 8 304.0 150 3.15 3.435 17.30 0 0 3 2 ## Camaro Z28 13.3 8 350.0 245 3.73 3.840 15.41 0 0 3 4 ## Pontiac Firebird 19.2 8 400.0 175 3.08 3.845 17.05 0 0 3 2 ## Fiat X1-9 27.3 4 79.0 66 4.08 1.935 18.90 1 1 4 1 ## Porsche 914-2 26.0 4 120.3 91 4.43 2.140 16.70 0 1 5 2 ## Lotus Europa 30.4 4 95.1 113 3.77 1.513 16.90 1 1 5 2 ## Ford Pantera L 15.8 8 351.0 264 4.22 3.170 14.50 0 1 5 4 ## Ferrari Dino 19.7 6 145.0 175 3.62 2.770 15.50 0 1 5 6 ## Maserati Bora 15.0 8 301.0 335 3.54 3.570 14.60 0 1 5 8 ## Volvo 142E 21.4 4 121.0 109 4.11 2.780 18.60 1 1 4 2 ``` ] ??? Ask for examples of data sets. --- ## Functions The take arguments and return objects and/or produce side effects. ```r View(mtcatrs) ``` ```r str(mtcars) ``` ``` ## 'data.frame': 32 obs. of 11 variables: ## $ mpg : num 21 21 22.8 21.4 18.7 18.1 14.3 24.4 22.8 19.2 ... ## $ cyl : num 6 6 4 6 8 6 8 4 4 6 ... ## $ disp: num 160 160 108 258 360 ... ## $ hp : num 110 110 93 110 175 105 245 62 95 123 ... ## $ drat: num 3.9 3.9 3.85 3.08 3.15 2.76 3.21 3.69 3.92 3.92 ... ## $ wt : num 2.62 2.88 2.32 3.21 3.44 ... ## $ qsec: num 16.5 17 18.6 19.4 17 ... ## $ vs : num 0 0 1 1 0 1 0 1 1 1 ... ## $ am : num 1 1 1 0 0 0 0 0 0 0 ... ## $ gear: num 4 4 4 3 3 3 3 4 4 4 ... ## $ carb: num 4 4 1 1 2 1 4 2 2 4 ... ``` --- class: inverse center middle # Your turn --- ## Lab: a complete R script - Available on [the course website](https://r4ds-sports.netlify.app/2023/09/20/session1/) - Download the script (`.R`) and datasets (`.rds`). ### What the script does - Opens two rds files with data from NBA teams. - Merges on the `Team` column. - Calculates the mean assits, blocks, steals for the teams that went to the playoffs and the ones that did not. - Create an `html` table with the results. --- ## TODO - Open the html file. Do Playoff teams have more points on average? - Open the script file in RStudio and run it. Make sure that it works correctly. - What functions does it use? - Can you identify which tasks each function supports (import, wrangling, model, communication)? - What objects does it create? - How many rows does the `df` data frame have? - Which are the columns?